Best-in-Class Amplifiers & Testing Insights
From radar to communications systems to EMC immunity testing, amplifiers play a key role across various applications. Whether you need high power with wideband ranges, or ultra-low phase noise, choosing the right amplifier solution is essential for success. On the testing end, instruments such as peak power sensors can assess amplifier linearity to ensure high-fidelity communications. Do you need to streamline testing for high-power radar amplifiers? We have the perfect application note for you: “GaN or GaAs, TWT or Klystron – Testing High-power Amplifiers for RADAR Signals using Peak Power Meters.”

Amplifier Linearity Testing
What is the Crest Factor Method?
Crest factor or the peak-to-average-power ratio (PAPR) is a single numerical value that is the ratio of a signal’s highest power level to its average power level.
High PAPR signals, such as digitally modulated signals used in OFDM systems, experience wide fluctuations in magnitude over time and are often difficult to manipulate and process efficiently. This behavior can affect an amplifier’s ability to reproduce signals accurately, leading to various challenges including non-linear operation.

Engineers can test amplifier linearity with the crest factor method, which includes the following instruments:
- An additive white Gaussian noise (AWGN) source produces a band-limited noise waveform to mimic multiple, real-world carrier signals.
- Peak power sensors measure the input and output of the amplifier.
Linear performance is verified if the crest factor of the input signal is relatively close to the crest factor of the output signal. If the output crest factor reduces significantly, then it indicates the amplifier has clipped the waveform’s highest peaks in power. This behavior points to nonlinearities in the system.
Non-linearity is further quantified by plotting complementary cumulative distribution function (CCDF) curves, which provides a statistical view of crest factor occurrence. A CCDF graph shows the percentage of time or probability (y-axis) that a signal’s crest factor is equal to or greater than a certain crest factor value (x-axis).
Solving Complex EMC & T&M Challenges
Maury Best-in-Class Amplifier Solutions
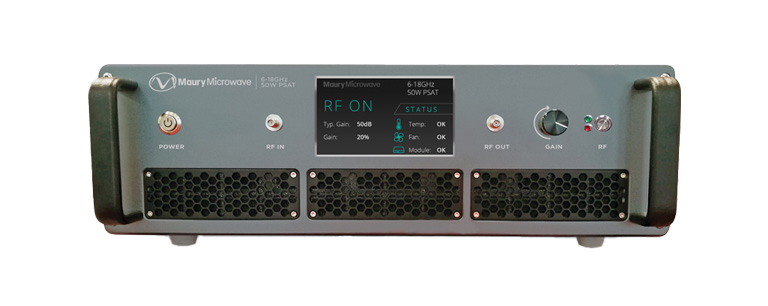
Not all amplifiers are created equal, so how can you be certain that an amplifier will work for your needs? You deserve to be confident that the amplifiers used with your test-and measurement lab benches will meet the requirements of your specific applications, are reliable, and are equally well-supported pre-and post-sale.
The MPA-series combines application expertise, reliability, and support, ideal for various applications such as EMC immunity testing.

Must-read resourceWant to Learn More?
Want to Learn More?
Read our App Note
Learn how to test high-power radar amplifiers accurately, efficiently, and reliable in the application note, “GaN or GaAs, TWT or Klystron – Testing High-power Amplifiers for RADAR Signals using Peak Power Meters.”
Understand why a peak power meter is ideal for characterizing the behavior of pulsed RF PAs used in radar systems, and download this informative resource today.