By Mazumder Alam – Product Marketing Manager, Boonton Electronics
ABSTRACT: The Boonton 55 Series USB power sensor offers very fast, accurate and highly reliable RF power measurements with the capability of making over 16 automated pulse power measurements on captured pulsed RF signals. These measurements are suitable for product development, compliance , manufacturing testing, and site monitoring applications. The Boonton Peak Power Analyzer Suite software for 55 Series USB power sensors enables you to make automated RF power measurements in a tabular format. The list of parameters from the USB power sensor can be displayed on your computer via the GUI or can be remotely controlled via API using IVI commands with a set of user-defined software functions. This application note describes how the Boonton 55 Series USB power sensor provides automated pulse and marker measurements both graphically and numerically.
Measuring Communication and Radar Signals
With today’s complex modulation schemes, increased popularity of wireless transmission and pulsed communication modes, the need to accurately and efficiently measure RF power has become crucial to obtaining optimum performance from communication systems and components. There are also various complex types of Radar signals used in different Radar applications. In almost all applications, it is necessary to perform basic RF pulse measurements. There are many challenges for Radar pulse measurements at system level testing due to pulse timing for many scenarios and capturing a large number of pulses. Although there are various instruments to measure pulse signals, peak power meters or USB peak power sensors are typically the most accurate one for time-domain RF power measurements for both Radar and communication signals. Peak power solution provides both time-domain graphical and tabular format that display numerical list of parameters detailing pulse characteristics including rise time, fall time, pulse width, overshoot and droop. The 55 Series USB power sensor provides the best method for meeting these challenges accurately and reliably with complex pulse signals such as RADAR and modern digitally modulates communication signals (i.e. LTE and Wi-Fi).
Analysis of a Simple Pulse Measurement
IEEE Std 181-2003 Standard Transition Pulses and Relative Waveforms Terms and Definitions provides fundamental definitions for general use in time domain pulse technology. Several key terms that are defined in this standard appear in the numerical display of the automatic pulse measurements using a peak power meter.

The key terms defined by the IEEE standard are abstracted and summarized below. These terms are referenced to the standard pulse illustrated in Fig 1.
| Term | Definition |
|---|---|
| Base Line | The two portions of a pulse waveform which represent the first nominal state from which a pulse departs and to which it ultimately returns. |
| Top Line | The portion of a pulse waveform which represents the second nominal state of a pulse. |
| First Transition | The major transition of a pulse waveform between the base line and the top line (commonly called the rising edge). |
| Last Transition | The major transition of a pulse waveform between the top of the pulse and the base line. (commonly called the falling edge). |
| Proximal Line | A magnitude reference line located near the base of a pulse at a specified percentage (normally 10%) of pulse magnitude. |
| Distal Line | A magnitude reference line located near the top of a pulse at a specified percentage (normally 90%) of pulse magnitude. |
| Mesial Line | A magnitude reference line located in the middle of a pulse at a specified percentage (normally 50%) of pulse magnitude. |
Automatic Marker and Pulse Measurement – Graphical and Numerical Display
The 55 series USB Peak Power sensor captures, displays and analyzes RF pulse power in time domains. Boonton Peak Power Analyzer software for 55 series USB power sensor is to displays the signal on a time domain graphical format called trace window as well as display measured pulse parameters numerically in a tabular format called automated measurements. The sensor reconstructs the waveform from points that fall within the display’s time window. This window is defined by the timebase and trigger delay. Numerical mode or tabular format displays text parameters of 16 time and power measurements for up to 8 channels simultaneously as well as xx automated marker measurements. Automatic pulse measurements are made on repetitive signals that meet the amplitude and timing conditions according to IEEE definitions.
The 55 Series USB Power sensor automatically analyzes the waveform data by using Real-Time Power ProcessingTM techniques and calculates key waveform parameters 100 times faster than conventional power meter. By selecting the “Trace” button a graph view displays the same pulse in time domain measurement. With the advantage of docking capabilities of the software, each measurement window allows convenient display for both graph and tabular windows with the numerical information. (Fig. 2)
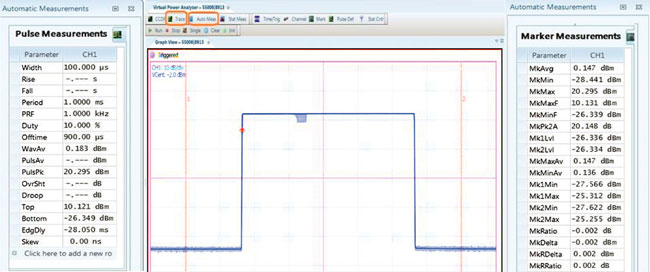
The calculated values are displayed in text mode in a tabular format by selecting the “Auto Meas” menu button from the software. Automated measurements are displayed on two tables, pulse and marker measurements. Automated marker measurements return power reading at specific time offsets from the trigger point where the markers are placed. For a pair of markers, the measurement includes average power, minimum and peak power over the interval between markers, and power ratio between markers. All automatic measurements are limited to the USB Sensor’s time window. Two vertical markers allow power level measurements at specific times relative to the trigger event. Automatic marker measurements table shows all related parameters as set in between two vertical marker positions.


| Pulse Measurements displayed on the automated measurements window are computed based on the IEEE Std 181-2003 definitions and can be set by clicking on the “Pulse Def” button. Distal, mesial, proximal and pulse units as well as pulse gate parameters can be adjusted to the user’s preference. Measurements such as rise time, fall time, and pulse width are affected by these adjustments. The list of displayed measurement parameters are: peak power, pulse power, average power, pulse width, rise time, fall time, overshoot, pulse period, pulse repetition rate, duty cycle, top amplitude, bottom amplitude, off time, edge delay and the delay between two RF pulses (skew). Fig. 4 shows an example of numerical parameters display for pulse measurements with the details on measurement parameters including rise time, fall time, PRF etc. |