Overview of Phase Noise
Phase noise refers to the random fluctuations in the phase of a signal, typically measured as a power spectral density (dBc/Hz) at a given offset from the carrier frequency. It directly affects the performance of systems relying on high-frequency signals, such as radar, telecommunications, and scientific instrumentation.
At millimeter-wave (mmWave) and sub-THz frequencies, phase noise becomes increasingly critical as the wavelengths are shorter, making the systems more sensitive to spectral purity.
Phase noise is quantified by sampling a signal of interest and analyzing its phase f luctuations. In advanced systems like the Maury Microwave HA7162D Phase Noise Analyzer, this is enhanced by using the cross-correlation technique to remove the test system noise, leaving only the noise of the device under test (DUT). The process includes:
- Splitting the DUT measurement signal of interest into two uncorrelated paths.
- Generating two stable, low-phase noise local oscillator (LO) signals. > Mixing the DUT and LO signals to produce an intermediate frequency (IF).
- Digitizing the noise spectrum at the IF.
- Performing a cross-correlation between the two measurement paths, thus eliminating the common system noise.
Using VDI Extenders for High-Frequency Phase Noise Analysis
Millimeter-wave and sub-THz frequencies often exceed the direct measurement capabilities of traditional phase noise analyzers. To address this, Virginia Diodes, Inc. (VDI) extenders, like the NTX Down-Conversion (DNC) module, are used to down-convert these signals into the analyzer’s frequency range.
Key Features of the VDI NTX Module
- Frequency Range: 75 GHz to 110 GHz (W-band) via WR-10 waveguide. 110 GHz to 170 GHz (D-band) via WR-6 (WR6.5) waveguide
- Dual LO Inputs: Supports uncorrelated signals to minimize measurement system noise.
- H1 & H2 Outputs: Provide single sideband (SSB) offset signals compatible with the HA7062D analyzer IF input limits.
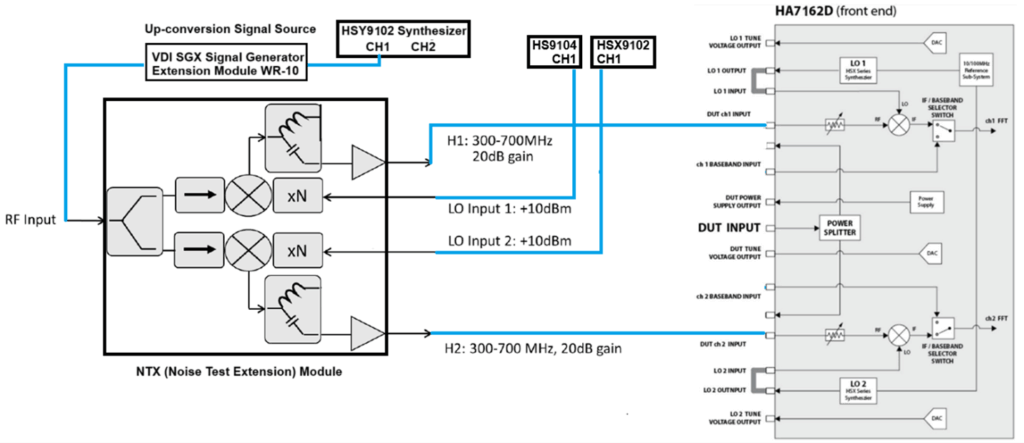
The NTX module, when combined with Holzworth synthesizers (e.g., HSX9102 and HS9104), forms a test setup with uncorrelated local oscillator signals that allow the cross-correlation process to remove analyzer phase noise.
Test Setup and Results for W-Band Measurements
In a recent evaluation, the NTX DNC module was used to down-convert signals generated by the VDI SGX Up-Converter. The HA7062D analyzer performed phase noise measurements on signals from 75 GHz to 110 GHz. Specific offsets (e.g., 500 MHz) were used to optimize SSB trace visibility. The block diagram of the test setup is shown in Figure 1 below.
The results demonstrated excellent agreement between measured and theoretical noise levels. For instance:
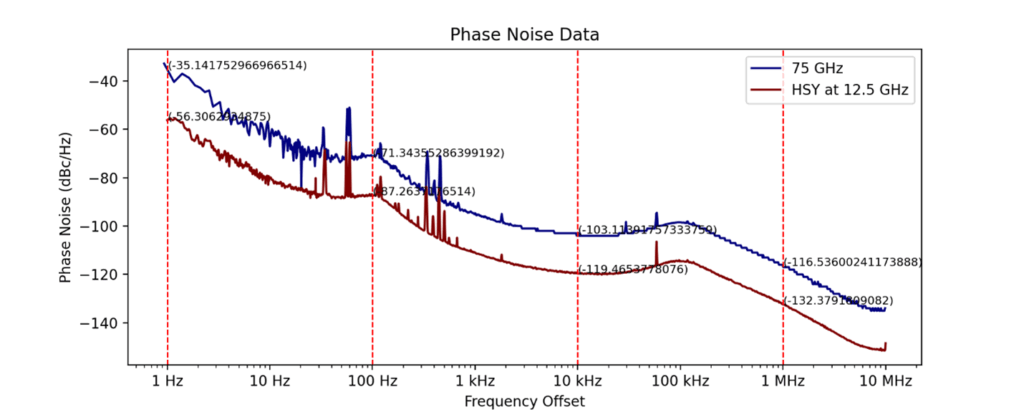
- A 75 GHz signal yielded a 10 kHz spot noise of -103.1 dBc/Hz.
- Comparisons with a 12.5 GHz direct RF input into a VDI SGX with multiplication factor of 6 showed good agreement with the theoretical results following 20log(N) rule where N is the multiplication factor. The 12.5 GHz at 10 kHz spot noise was -119.5 dBc/Hz, yielding a difference of 16.4 dB, thus confirming the accuracy of the down-conversion process.
Phase noise analysis at 75 GHz is shown in Figure 2 below.
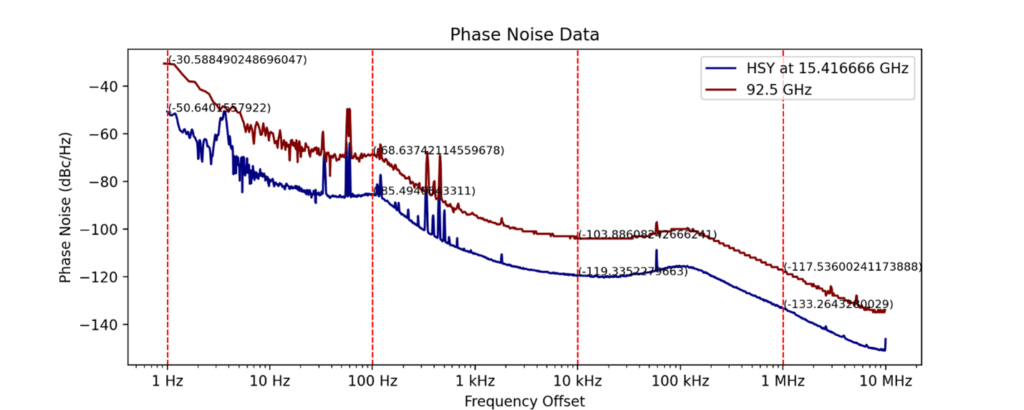
Similar performance can be seen at 92.5 GHz, in Figure 3.
The following table shows the results at 75 GHz, 77 GHz, 87.5 GHz, 92.5 GHz, 100 GHz, and 110 GHz. The measured phase noise at each frequency falls within the phase noise analyzer absolute measurement uncertainty for SSB trace values >1 kHz of +/- 2.0 dB.
| Frequency | Value Measured Phase Noise | Direct RF Input | Difference | Calculated Phase Noise Value [20 * log10(6), for a 6× multiplier] |
Possible Error Value |
|---|---|---|---|---|---|
| 75 GHz | -103.12 | -119.45 | 16.33 | 15.5 | 0.83 |
| 77 GHz | -104.01 | -119.82 | 15.81 | 15.5 | 0.31 |
| 87.5 GHz | -102 | -119.59 | 17.59 | 15.5 | 2.09 |
| 92.5 GHz | -103.88 | -118.98 | 15.46 | 15.5 | -0.04 |
| 100 GHz | -103 | -119.15 | 16.15 | 15.5 | 0.65 |
- Measured phase noise: the measured values from the down conversion process.
- Direct RF input: the direct RF output from the HSY9102.
- Difference: the difference between the measured, down-converted phase noise minus the direct synthesizer measured.
- Possible Error Value: This is the difference value compared to the theoretically calculated phase noise from the X6 down conversion process of the NTX DNC.
- Frequency Values: the six pre-selected values of the WR-10 waveguide.
Furthermore, the measurement results could be improved by increasing the number of cross-correlation sweeps to >100, removing the residual test system noise.
Test Setup and Results for D-Band Measurements
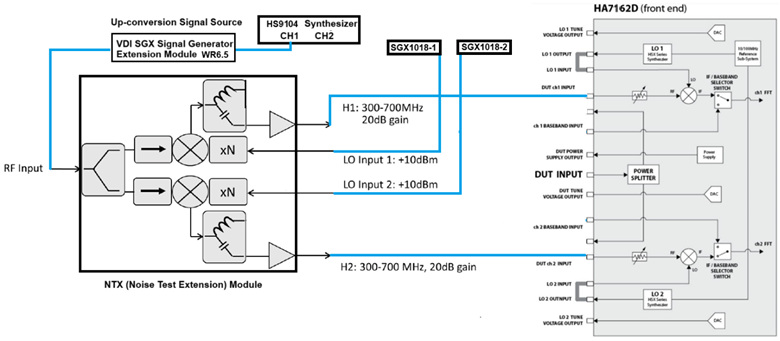
Like our WR10 measurements, an NTX DNC module was used to down-convert signals generated by the VDI SGX Up-Converter. The HA7162D analyzer performed phase noise measurements on signals from 110 GHz to 170 GHz. The block diagram of the test setup is shown in Figure 4 below.
The results demonstrated excellent agreement between measured and theoretical noise levels. Phase noise analysis at 110 GHz, 125 GHz, 140 GHz, 155 GHz and 170 GHz is shown in Figure 5 below (all five frequencies are plotted on the same phase noise graph).

The following table shows the results at 110 GHz, 125 GHz, 140 GHz, 155 GHz and 170 GHz. The measured phase noise at each frequency falls within the phase noise analyzer absolute measurement uncertainty for SSB trace values > 1 kHz of +/- 2.0 dB.
| Frequency Value | 75 GHz | 77 GHz | 87.5 GHz | 92.5 GHz | 100 GHz | 110 GHz |
| Measured Phase Noise | -103.12 | -104.01 | -102 | -103.88 | -104 | -103 |
| Direct RF input | -119.45 | -119.82 | -119.59 | -118.98 | -119.34 | -119.15 |
| Difference | 16.33 | 15.81 | 17.59 | 15.46 | 14.98 | 16.15 |
| Calculated Phase Noise Value | 15.5 | 15.5 | 15.5 | 15.5 | 15.5 | 15.5 |
| [20 *log10(6), for a 6× multiplier] | ||||||
| Possible Error Value | 0.83 | 0.31 | 2.09 | -0.04 | -0.52 | 0.65 |
Advantages of the Holzworth HA7062D
The HA7162D’s advanced architecture, including internal cross-correlation and its ability to interface with high-frequency extenders like the VDI NTX, makes it an ideal tool for phase noise analysis in the mmWave and sub-THz domains. Key benefits include:
- Removal of test system noise using the cross-correlation process.
- Flexibility in adapting to a variety of test setups with external extenders.
- Robust software for detailed phase noise plots and analysis
Conclusion
Phase noise analysis at mmWave and sub-THz frequencies present unique challenges, but tools like the Maury Microwave HA7162D, combined with VDI extenders, provide an effective solution. The integration of the NTX DNC module ensures precise downconversion, enabling reliable phase noise characterization critical for high-frequency applications. NTX DNC modules are available to extend the effective frequency range of the HA7162D up to 330 GHz.