Crest factor is a significant ratio to measure during the testing of wireless systems and devices. In this blog post, learn how to calculate crest factor, the impact of high crest factor signals, and why this ratio is important to validate designs and test system performance.
The Crest Factor Formula
Crest factor, also referred to as the peak-to-average power ratio (PAPR), is a figure of merit used to better understand the shape of a waveform. It takes the ratio of the peak amplitude to the average amplitude or root-mean-square (RMS) value.
A unitless calculation, the formula for crest factor can be expressed as:
Crest factor = Vpeak/Vavg
Where:
Vpeak = Peak voltage
Vavg = Average voltage
Often, crest factor is converted to decibels (dB) with the following equation: Crest factor = 20log(Vpeak/Vavg).
Crest Factor Examples & Significance
Signals with a high crest factor are more dynamic and have severe peaks that stray far from average power readings. Low crest factor signals have a lower peak amplitude relative to the average power level.
Direct current (DC) waveforms have the lowest possible crest factor of 1, which converts to 0 dB. The electric charge of DC waveforms flows in one direction at a specific magnitude over time. There are no signal peaks since the magnitude remains constant, meaning the peak amplitude is the same as the average amplitude.
Alternating current (AC) waveforms change in both magnitude and direction over time. A sinusoidal wave, for example, is always changing in value – from zero, reaching a positive peak value, crossing zero again, reaching its negative peak value, and so on. The crest factor of a pure sine wave is 1.414, which equates to 3.01 dB.
-
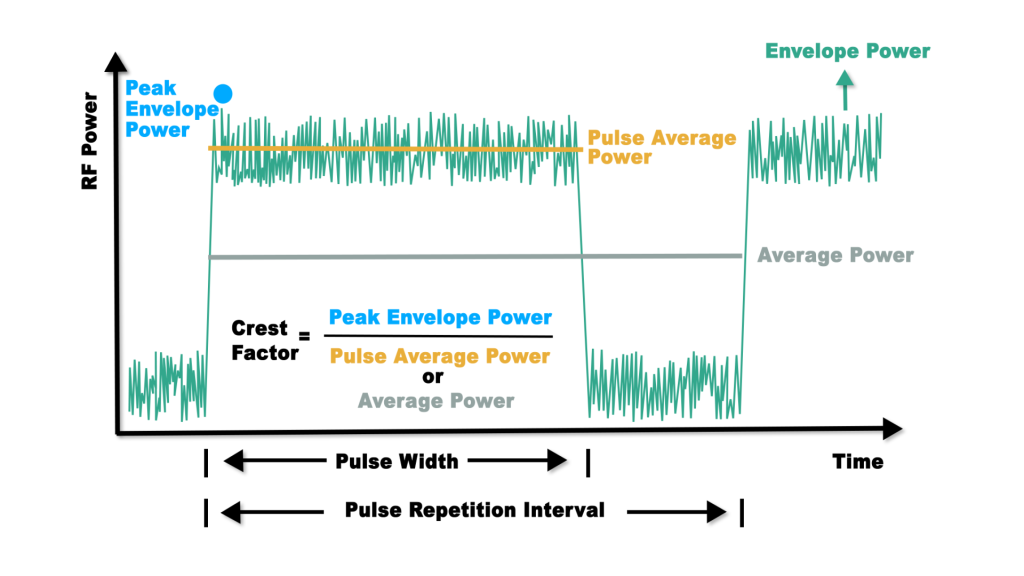
Crest Factor of a Pulse
The crest factor of a pulsed signal can be calculated by taking the peak envelope power over either the average power during the pulse repetition interval (average power) or the average power of the pulse (pulse average power).
-
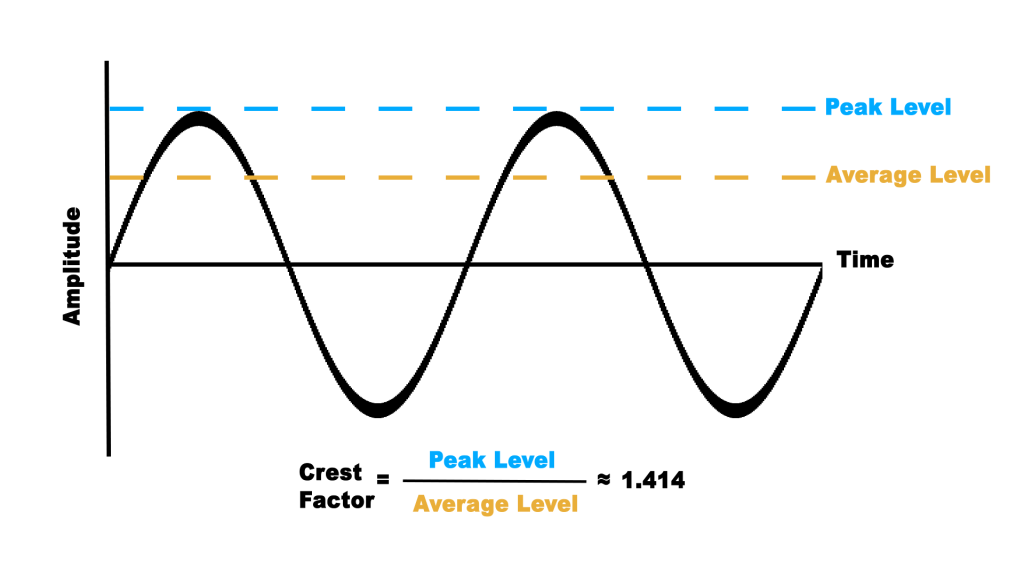
Sine Wave Crest Factor
The crest factor of an ideal sine wave is the ratio of peak to average power levels, which approximates to 1.414 or 3.01 dB.
-
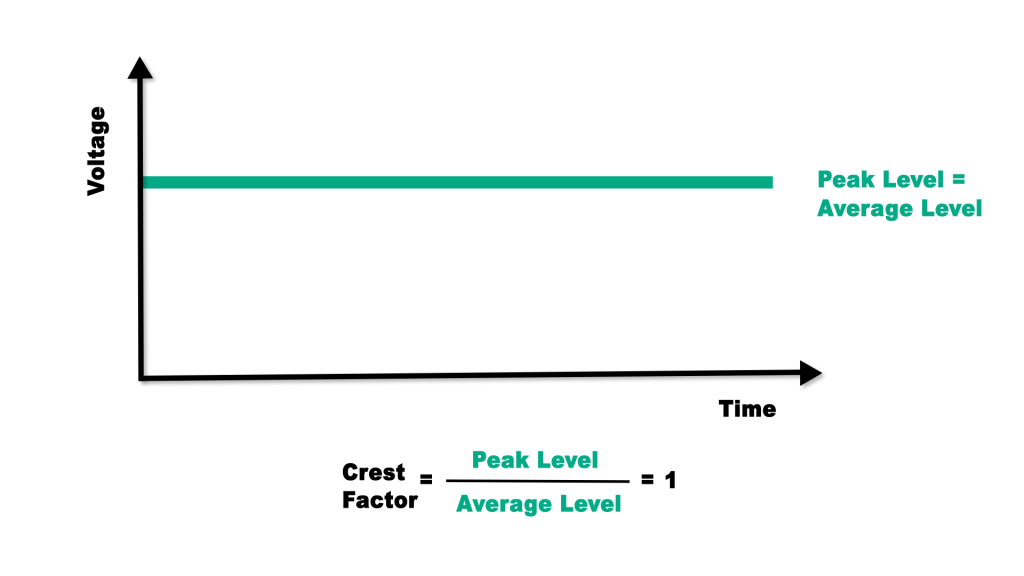
Crest Factor of DC Waveforms
Peak and average power levels are the same for DC waveforms due to the unidirectional flow of current at a constant magnitude. Without any signal peaks, DC waveforms have a crest factor of 1.
In this case, an absolute phase noise measurement is the appropriate choice to test the performance of an OCXO.
An absolute phase noise measurement compares the DUT to the analyzer’s internal local oscillators (LOs), which means the LOs must have lower phase noise (or better phase noise performance) than the DUT. While increasing the number of cross correlations may be able to resolve a minor difference in performance, some cases require “External LO Mode” operation. This setup uses two high-performance external sources as the LOs, which connect to the HA7062D’s front end LO1 and LO2 input ports.
Users can adjust various additional measurement settings. Two of note include:
- The measurement offset range to select the frequency start and stop points.
- The desired number of correlations for the analyzer to perform.
After these selections, users can measure the phase noise of an oscillator and change parameters accordingly after viewing results.
Now, let’s take a look at a bursted Wi-Fi 6 (802.11ax) signal using 64-QAM modulation, captured and analyzed by the Boonton RTP5000 Series real-time peak power sensor and Boonton Power Analyzer software. Measuring a portion of a single Wi-Fi packet reveals a crest factor of approximately 11 dB.
Digital modulation schemes, such as orthogonal frequency-division multiplexing (OFDM), suffer from high crest factors, experiencing a relatively low average power with occasional high peaks in power. Multi-carrier OFDM systems add together numerous, independently modulated subcarriers, which can increase the magnitude of the peak amplitude. The average power, however, may stay relatively low due to factors like destructive interference between subcarriers.
High crest factors can affect the linear operation of amplifiers. Engineers can increase the input back-off (IBO) value to resist nonlinear operation. The IBO value reduces the amplifier’s input power to achieve a desired linearity, which by consequence also reduces efficiency and the range of wireless systems. For OFDM systems to achieve efficiency, desired coverage, and reliable performance, designers often consider implementing various crest factor reduction techniques.
Crest Factor Use-Case: Amplifier Linearity Testing
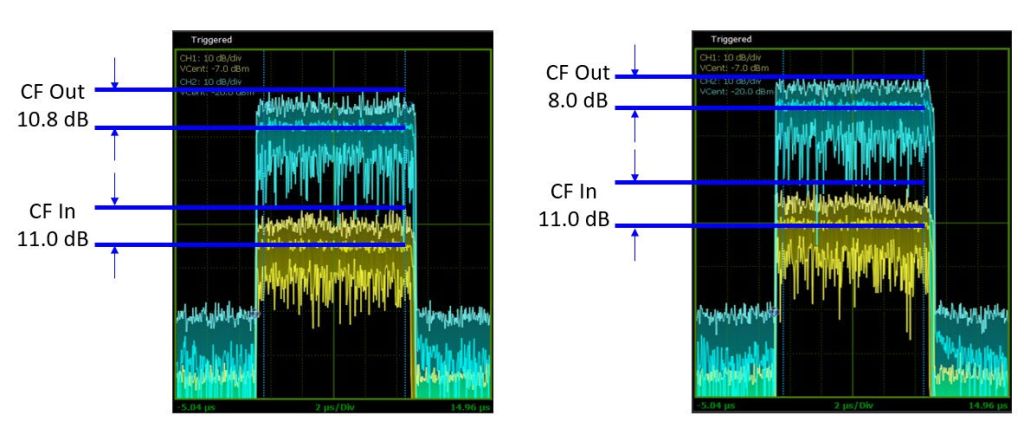
Calculating the crest factor of both an amplifier’s input and output signals can uncover nonlinear behavior. The test uses an additive white Gaussian noise (AWGN) signal to simulate the traffic of a multi-carrier system. A peak power sensor captures the signal going into the amplifier, while another captures the signal leaving the amplifier.
Linear performance is verified if the crest factor of the input signal is relatively close to the crest factor of the output signal. If the output crest factor reduces significantly, then it indicates the amplifier has clipped the waveform’s highest peaks in power. This behavior points to nonlinearities in the system.
Watch Now: Crest Factor Measurements of Wide Bandwidth Signals
To accurately capture the crest factor of wide bandwidth signals, such as those used in Wi-Fi 6 (80 MHz and 160 MHz) and 5G (100 MHz), peak power sensors must have a wide enough video bandwidth. In the video, “Measuring Crest Factor of Wide Bandwidth Signals with Boonton RTP5000,” learn how to measure the crest factor and statistical analyze wide bandwidth signals using the RTP5000 Series, which among its various key features offers 195 MHz of video bandwidth.